
GBP/JPY Price Forecast: RSI signals exhaustion after a steep 4% decline
- GBP/JPY stages a limited recovery as the Japanese Yen pauses its recent advance.
- The cross holds near its lowest level in nine months after breaking several key supports.
- Downside momentum persists, although the oversold RSI leaves room for a rebound.
GBP/JPY edges higher on Wednesday as the Japanese Yen (JPY) weakens across the board, likely reflecting some profit-taking after the currency’s strong run since the start of the month. Meanwhile, oversold conditions shown by the daily Relative Strength Index (RSI) suggest scope for a short-term rebound in the cross.
At the time of writing, the cross trades around 208.55 after touching 207.10 earlier this week, its lowest level since December 2025.
GBP/JPY has slid around 4% from above 216 in a steep decline, pushing the cross below its 50-day, 100-day and 200-day Simple Moving Averages (SMAs), as well as the long-standing 210 psychological support level. This breakdown has weakened the broader bullish structure, with 210 now likely to act as resistance during recovery attempts.
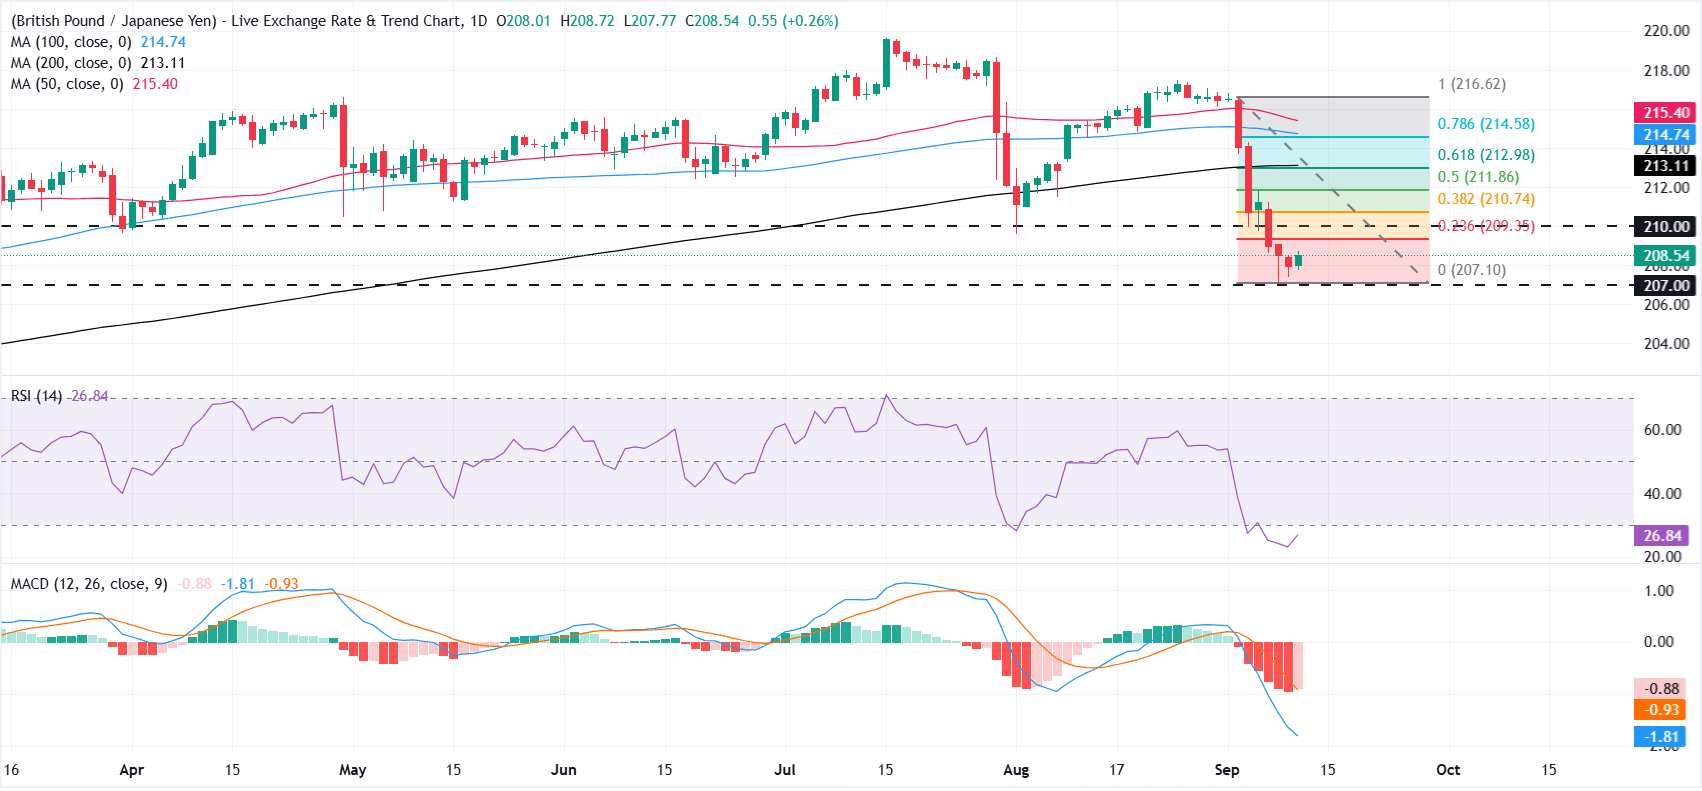
All three major moving averages sit above the current price, creating a broad resistance area between 213 and 215.50. However, the averages are still arranged in a longer-term bullish order, with the 50-day SMA above the 100-day and 200-day averages. This suggests the latest decline has damaged the trend, although it has not produced a fully bearish moving-average alignment.
The Relative Strength Index near 27 shows that the cross is oversold, leaving room for a corrective rebound or a period of consolidation. However, the Moving Average Convergence Divergence indicator remains below zero, suggesting that downside momentum is still in place.
On the topside, initial resistance is seen at the 23.6% Fibonacci retracement of the decline from 216.63 to 207.10 at 209.35. The 210psychological mark follows, ahead of the 38.2% retracement at 210.74. A sustained recovery could target the 50.0% retracement at 211.86 and the 61.8% level at 212.98.
Above this area, the 200-day SMA at 213 provides another key barrier. Stronger buying would bring a dense resistance zone in the mid-214.00s into view, where the 78.6% Fibonacci retracement and the 100-day SMA converge. The 50-day SMA at 215 forms the final major hurdle before the previous swing high.
On the downside, initial support is located around 207. A clear break below this level could extend the decline, while holding above it may encourage a short-covering recovery toward 210.
(The technical analysis of this story was written with the help of an AI tool. Know more.)
Japanese Yen Price Today
The table below shows the percentage change of Japanese Yen (JPY) against listed major currencies today. Japanese Yen was the strongest against the Australian Dollar.
| USD | EUR | GBP | JPY | CAD | AUD | NZD | CHF | |
|---|---|---|---|---|---|---|---|---|
| USD | 0.08% | 0.09% | 0.37% | 0.08% | 0.31% | 0.07% | 0.15% | |
| EUR | -0.08% | 0.02% | 0.27% | -0.01% | 0.23% | -0.01% | 0.07% | |
| GBP | -0.09% | -0.02% | 0.27% | -0.03% | 0.21% | -0.03% | 0.06% | |
| JPY | -0.37% | -0.27% | -0.27% | -0.29% | -0.05% | -0.32% | -0.21% | |
| CAD | -0.08% | 0.00% | 0.03% | 0.29% | 0.24% | -0.01% | 0.08% | |
| AUD | -0.31% | -0.23% | -0.21% | 0.05% | -0.24% | -0.24% | -0.14% | |
| NZD | -0.07% | 0.01% | 0.03% | 0.32% | 0.01% | 0.24% | 0.12% | |
| CHF | -0.15% | -0.07% | -0.06% | 0.21% | -0.08% | 0.14% | -0.12% |
The heat map shows percentage changes of major currencies against each other. The base currency is picked from the left column, while the quote currency is picked from the top row. For example, if you pick the Japanese Yen from the left column and move along the horizontal line to the US Dollar, the percentage change displayed in the box will represent JPY (base)/USD (quote).